
Status: draft. Verified steps and screenshots to come.
Draw streamlines through a simulated flow in ParaView, and color them by temperature. Time: 10 minutes · Program: ParaView · Also in: MATLAB
| Before this | Data | You'll need |
|---|---|---|
| Start ParaView on OnDemand | disk_out_ref.ex2: air around a heated, spinning disk. It comes with ParaView (BSD-3) |
A running ParaView session |
Note
Cluster details. Highlighted values are placeholders. AMA27's queue names, module versions, paths and addresses go in when the cluster is deployed.
Why this matters
The practice data has a velocity vector at every mesh point. Arrows show a sample of them; streamlines connect the samples into curves, so you can see the dome of rising air over the heated disk instead of a scatter of arrows. The two filters used here work on any vector field ParaView can read.
Key idea
Stream Tracer starts at a point you give it and integrates the velocity field from there until the curve leaves the data. Those points are the seeds, and they decide which part of the flow you see: a small cloud in the middle of the domain shows the middle of the flow and nothing about the corners. If a region looks empty, widen or move the seeds before deciding the flow is quiet there. → Glossary: streamline
Steps
Step 1: Open the data as an outline
Open disk_out_ref.ex2 as in the ParaView starter and click Apply. Then set the Representation drop-down on the toolbar from Surface to Outline.
You should see: a box outline, so you can see inside the flow domain.
Screenshot: the Representation drop-down set to Outline
Screenshot to come: The toolbar's Representation drop-down set to Outline, with the data shown as a box outline
Step 2: Add a stream tracer
Select disk_out_ref.ex2 in the Pipeline Browser and choose Filters ▸ Alphabetical ▸ Stream Tracer. In Properties, set Vectors to V. Set Seed Type to Point Cloud and untick Show Sphere. Click Apply.
You should see: thin lines swirling through the domain, starting from a cloud of points near its middle.
Screenshot: Stream Tracer's properties, with Vectors and Seed Type marked
Screenshot to come: The Properties panel for StreamTracer1, with Vectors set to V and Seed Type set to Point Cloud marked
Step 3: Make the lines visible
With StreamTracer1 selected, choose Filters ▸ Alphabetical ▸ Tube and click Apply.
You should see: the lines become tubes, thick enough that you can tell which line is in front.
Step 4: Color by temperature
With Tube1 selected, choose Temp in the toolbar's coloring drop-down and click Rescale to Data Range. Choose the Viridis preset (see Step 5 of the starter).
You should see: tubes colored by the air's temperature: hot near the heated disk, cooler where fresh air enters.
What you should see
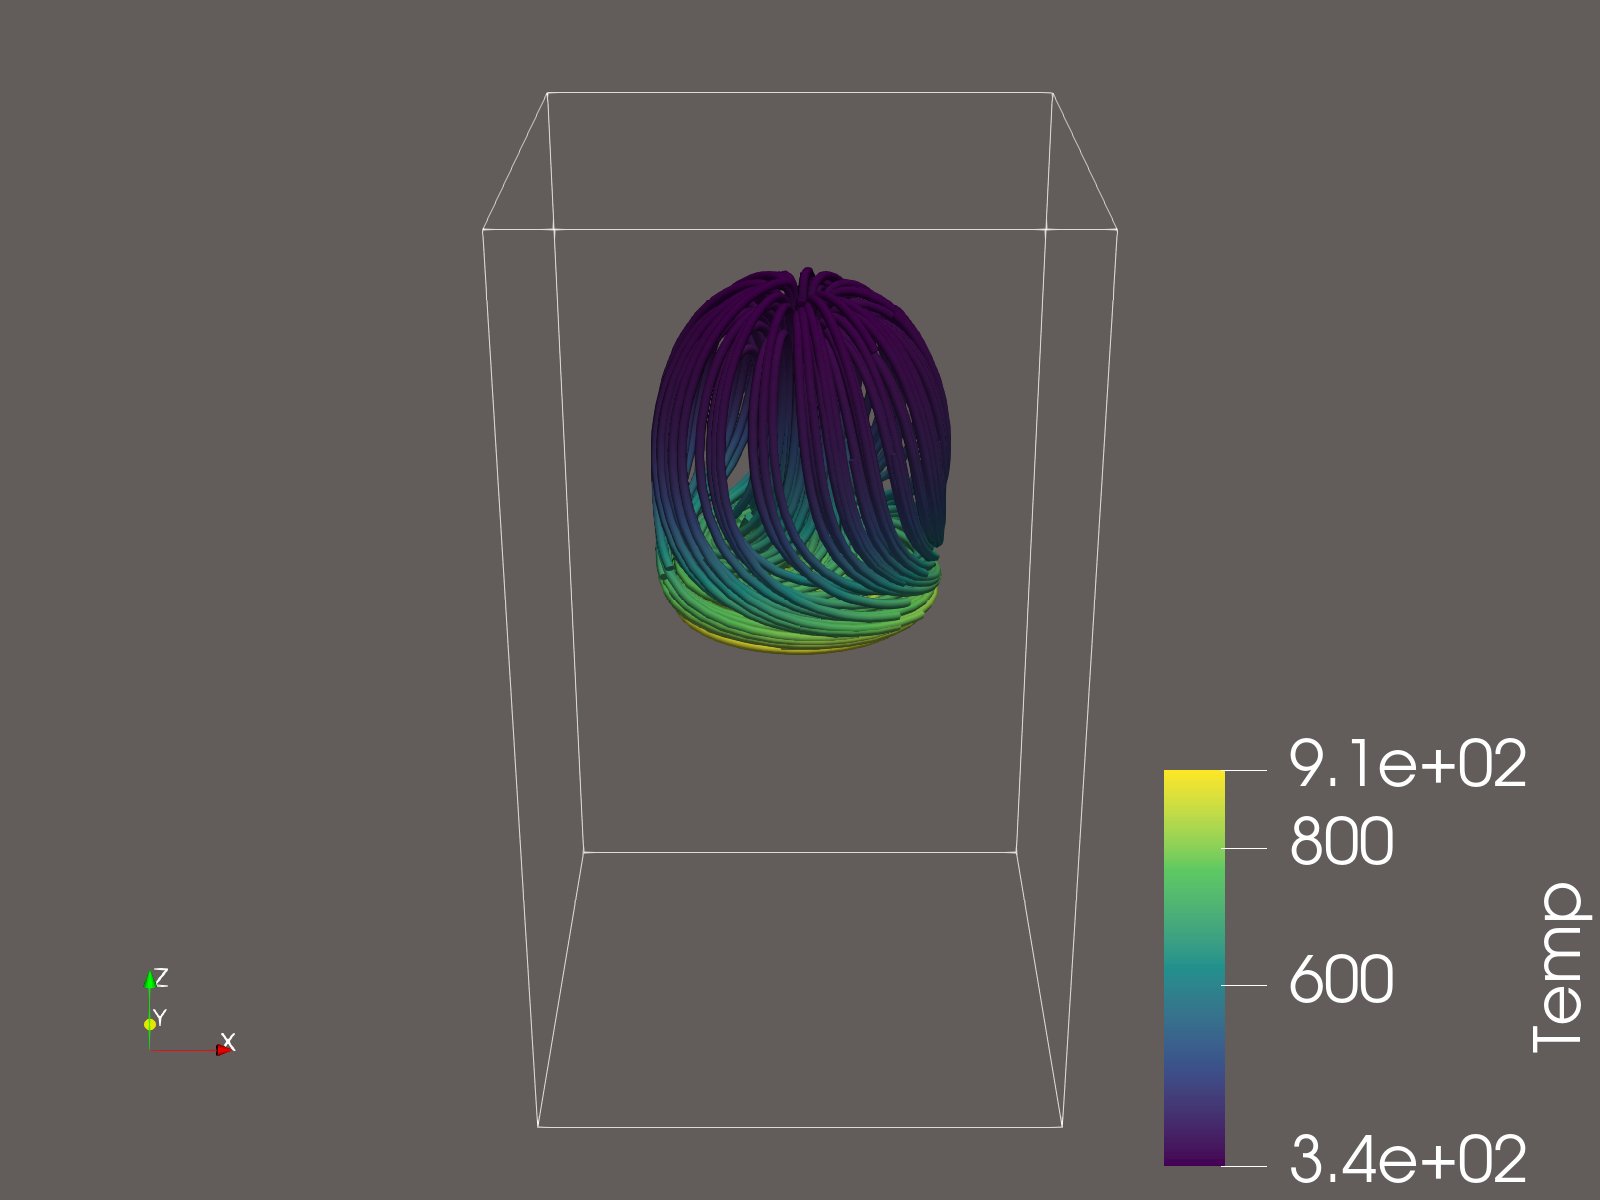
disk_out_ref.ex2, colored by temperature with Viridis, drawn by the lesson's script. Yellow is the hottest air.Step 5: Save the picture
Choose File ▸ Save Screenshot… and save to ~/scratch/streamlines.png at 1600 by 1200.
You should see: the image in the Files app. To make the same picture without clicking, run scripts/streamlines.py with pvbatch.
Check your understanding
Your streamlines all bunch up in one corner and miss the region you care about. What do you change first?
The seeds. Enlarge the point cloud or move its center. Or switch Seed Type to Line and lay that line across the inflow, so every curve starts upstream of what you want to see.
Why color the streamlines by temperature instead of drawing them in one color?
The line shows where the air goes and the color shows how hot it is along the way. In a single color you could not tell which lines carry the heat.
If something goes wrong
| What you see | Why | What to do |
|---|---|---|
| Stream Tracer makes nothing | Vectors isn't set to the velocity, or the seeds are outside the data | Set Vectors to V, and reset the seed position (the reset button next to the point-cloud settings) |
| Only a few short lines | The seed cloud is small, or the flow is slow near the seeds | Raise Number Of Points and Radius under the seed settings, then Apply |
Temp and V aren't in the lists |
Your ParaView shows variable names in lower case | Choose temp and v instead |
Next
Credits
Data: disk_out_ref.ex2, ParaView example data (Kitware/Sandia), BSD-3-Clause.