
Status: draft. Verified steps and screenshots to come.
Draw a molecule's electron density and one of its orbitals as surfaces, at values you choose. Four programs read the same two files. Time: 10 to 15 minutes, depending on the program
Quantum-chemistry programs compute numbers on a 3-D grid: the electron density, orbitals, the electrostatic potential. A cube file stores that grid, along with the positions of the atoms, and each program below turns it into a surface.
Note
Cluster details. Highlighted values are placeholders. AMA27's queue names, module versions, paths and addresses go in when the cluster is deployed.
Choose your program
Each program has its own page below. They cover the same ground.
| Program | Lesson | What it suits | Minutes |
|---|---|---|---|
| GaussView | Orbitals and density in GaussView (page to come) | Work that already runs in Gaussian. Its license covers a named group: AMA27 Gaussian access, to come | 10 |
| ParaView | Orbitals and density in ParaView | Pictures you want to script, or a pipeline you are already using | 15 |
| ChimeraX | Orbitals and density in ChimeraX (page to come) | Work that also involves proteins or cryo-EM maps. It reads the grid from a cube file, but not the atoms, so the molecule comes from the PDB file | 10 |
| PyMOL | Orbitals and density in PyMOL (page to come) | Publication figures, drawn the way PyMOL draws proteins | 10 |
What each program's result looks like
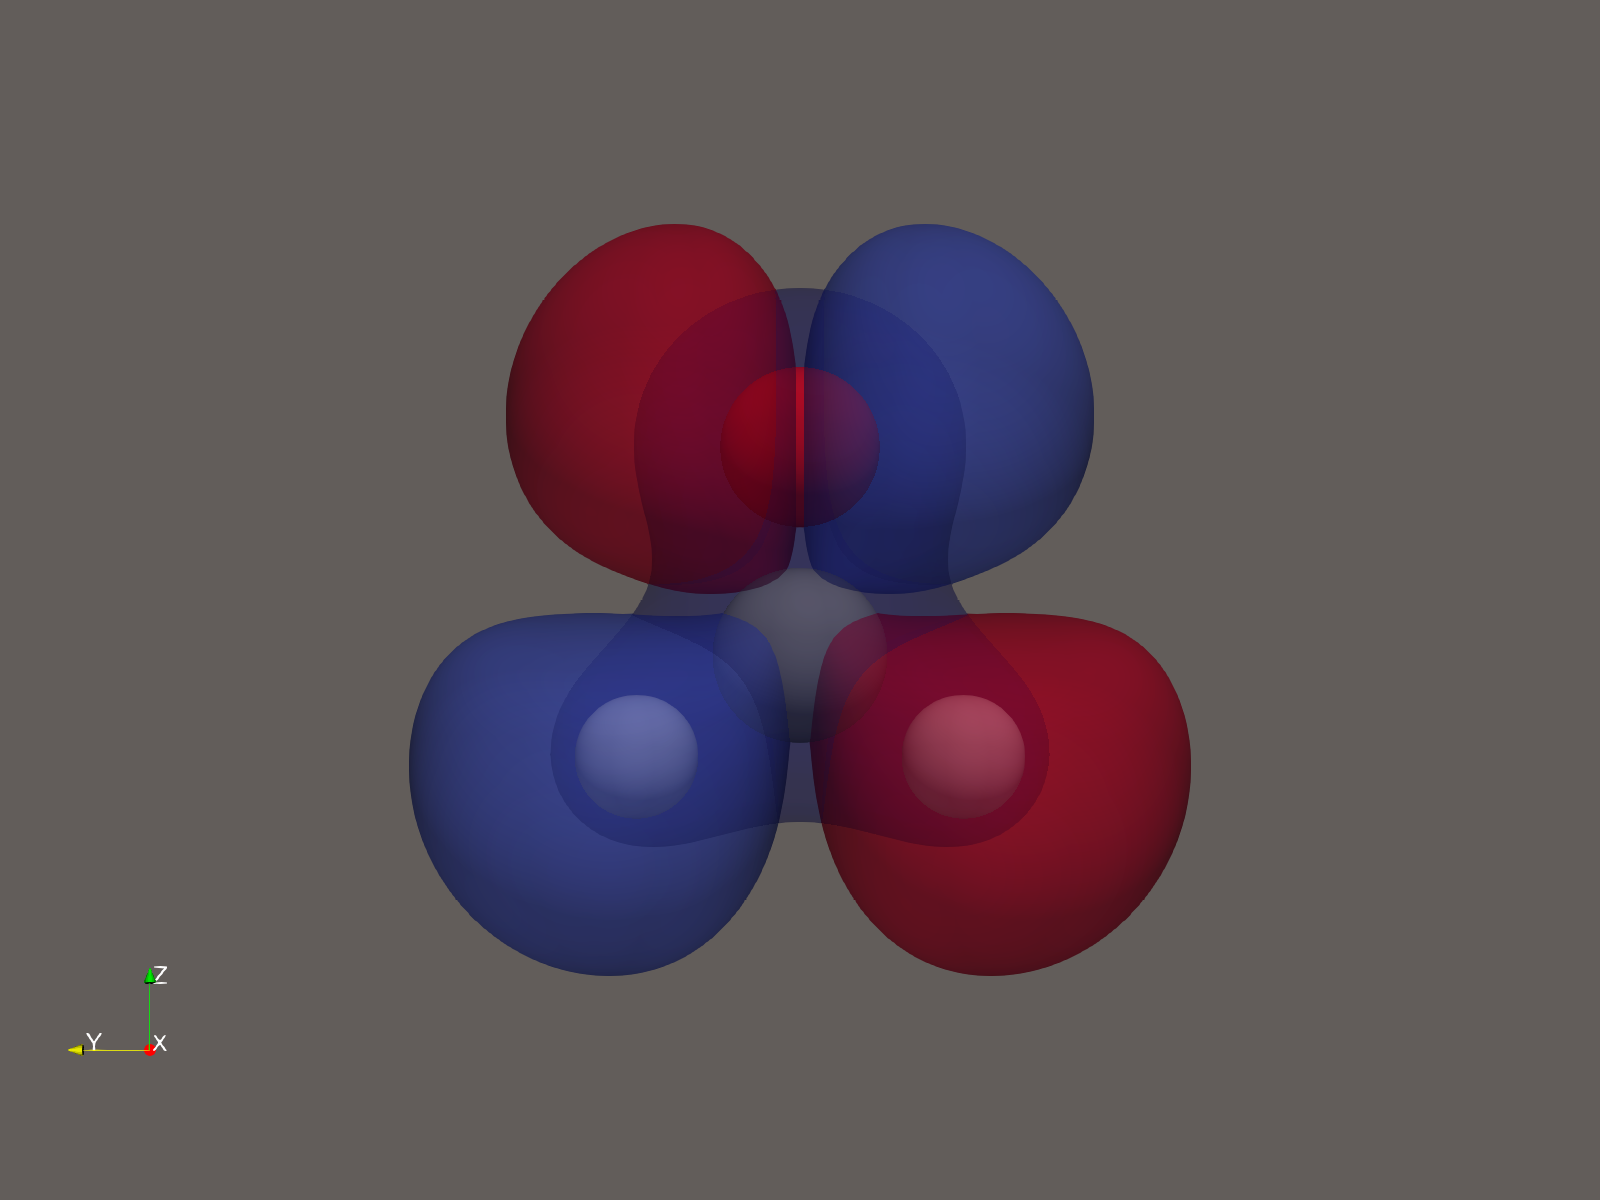
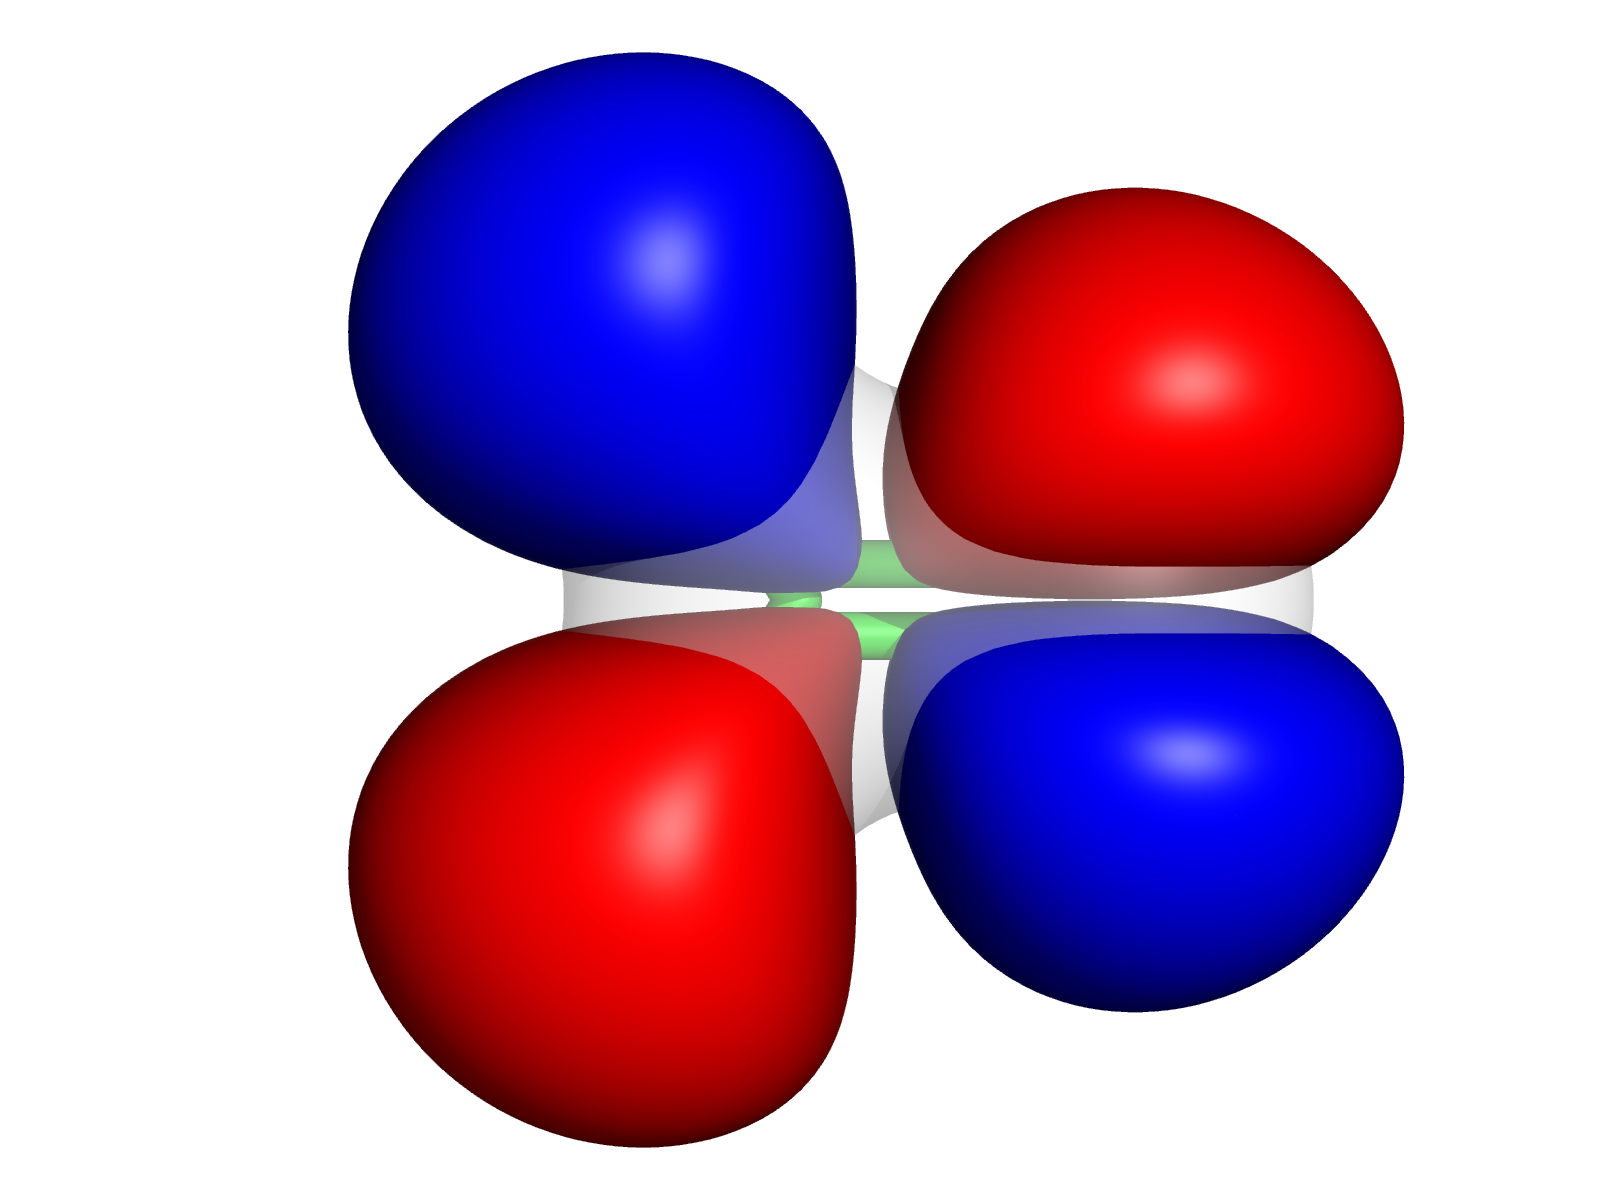
The same orbital, from the same cube files, drawn by the ParaView and PyMOL lessons' scripts. The lobes are the same shape and size in both. Only the drawing style differs. Pictures from GaussView and ChimeraX follow once the lesson has been run in them.
Get the cube files
Every version starts from the same calculation of formaldehyde, H₂CO. It writes density.cube and homo.cube, which all four programs read, and formaldehyde.pdb, which PyMOL and ChimeraX use for the atoms.
The script needs PySCF, which comes with one of the cluster's Python modules. It also needs a copy of the lesson's scripts in your home directory (AMA27 copy of the lesson files, to come). It writes into ~/scratch, so make that folder first with step 2 of the data lesson.
Run in: the OnDemand desktop terminal. Load AMA27's Python module with PySCF in place of the first line.
module load python-with-pyscf
python ~/ama27-curriculum/tutorials/visualization/scripts/make_cubes_pyscf.py --out ~/scratch/cubes --check
You should see: six lines starting check:, each ending in PASS. Your ~/scratch/cubes folder now holds five files: the three above, plus esp.cube and lumo.cube for later lessons. The calculation takes about a minute.
If Python reports ModuleNotFoundError: No module named 'pyscf', the module isn't loaded in this terminal: run the module load line again.
What every version teaches
An isosurface is the set of points where the grid equals a value you choose, its isovalue, and that value decides the shape. For the density, 0.0004 e/bohr³ encloses almost all the electrons and gives a surface about the size of the molecule. A larger value, 0.05, follows the atoms and bonds, because the density only reaches it near the nuclei. An orbital has positive and negative regions, so it needs two surfaces, at +0.02 and −0.02, in two colors. Density is positive everywhere, so one surface covers it.